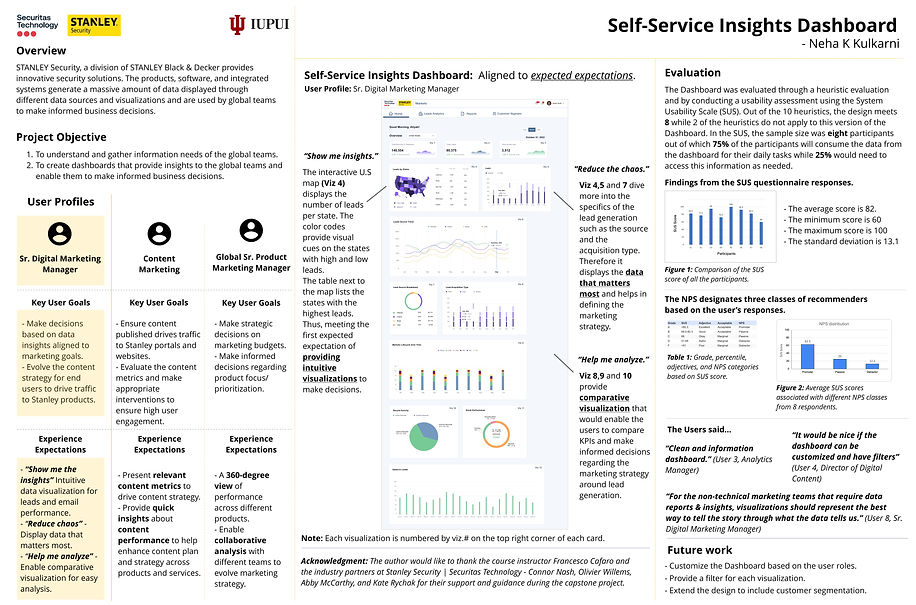
Overview: STANLEY Security (now Securitas Technology), a STANLEY Black & Decker division, provides innovative security solutions. The products, software, and integrated systems generate a massive amount of data displayed through different data sources and visualizations and are used by global teams to make informed business decisions.
Project: Developed a data-driven, actionable lead generation dashboard for the commercial security solutions team, enabling informed business decisions and increased sales.
Role: UX Design Lead (Research, Content and Design)
Goals - Business, Product and Content Design
-
Business Goals
-
Understanding global teams' information needs to create an insightful self-service dashboard.
-
Provide data-driven insights to inform global business decisions.
-
-
Product Design Goals
-
Design an intuitive dashboard interface so users can easily navigate and find relevant information.
-
Implement customizable data visualization through flexible, interactive charts and graphs that users can adjust to view relevant data.
-
Optimize for various devices through responsive design.
-
-
Content Design Goals
-
Develop clear data labels and descriptions so that data can be interpreted correctly.
-
Create concise, actionable insights summaries that enable brief and meaningful interpretation of data.
-
Implement multilingual support so that all content - including labels, descriptions, and insights can be accurately translated into multiple languages while maintaining clarity and context.
-
Design a scalable information hierarchy that allows the users to get high-level overviews and drill down into more detailed data as needed, catering to different roles and information needs within global teams.
-
Approach: The end-to-end design process is outlined below.
Research
-
Designed and conducted user studies to identify pain points and user goals and derive expected experiences for seamless task execution.
-
Applied qualitative research techniques to synthesize and analyze research data, derive themes, and be actionable for design deliverables.
-
Applied quantitative techniques to evaluate the designs during the early stages and the final design.
Strategy
-
Created holistic UX strategy and vision with cross-functional teams. Created user stories in JIRA and managed tasks through JIRA and spreadsheets.
Design - Content and Product Design
-
Defined the information architecture and the microcopy for the Dashboard.
-
Created the interaction for visualization for the dashboard - Phase 1 and Phase 2.
-
Proposed chatbot interactions using CUI methods to be included in Phase 2.
-
Designed UI kit with components, color palette, and typography.
-
Evaluated the design through walkthroughs, demos, and surveys to derive the system Usability Score (SUS) and the Net Promoter Score (NPS).
-
Outlined the future work gathered through evaluation and user feedback—actionables for content and product design.
Impact
-
Created data visualizations with the analytics team, improving marketing strategies and product traffic by 8%.
-
Utilized Jobs to be Done framework to enhance product-market fit, saving development costs.
-
Launched AI Chatbot for customer self-service.
-
Implemented self-service insights dashboard, boosting lead generation by 20% and marketing efficiency by 30%.
The detailed process is described below.
User Profiles
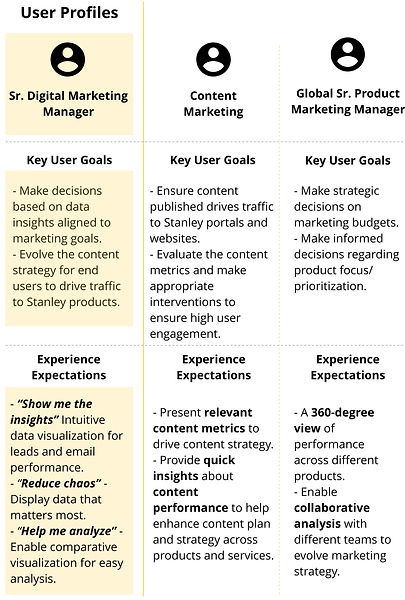
Overview: Persona workshop to identify key user profiles. This was followed by in-depth user interviews with key users to understand their goals, pain points, and expectations that informed design outcomes.
Using affinity mapping, synthesized and analyzed the interview insights. Conducted three rounds of coding to identify primary and secondary user profiles, key user goals, and expected expectations of the users.
Activities: User Interview, Affinity map
Tools: Google Docs and Miro
Prototype
Overview: In this phase, the insights from user interviews led to creating task flows. These task flows were the guide for initial designs (paper sketches). These paper sketches were translated into the first draft of the designs in Figma. The final prototype was created through co-designing sessions with the users.
This dashboard was aligned with the expected experience of the primary user.
Activities: Task flows, paper sketches, Co-designing sessions.
Tools: Miro, Adobe XD, Figma, Tableau

Evaluation & Future Work

Overview: The prototype was first evaluated by applying the heuristics. It was then tested with users through surveys and walkthrough interviews to calculate the System Usability Score (SUS) and the Net Promoters Score (NPS).
Activities: Heuristic evaluations and user testing.
Tools: Google Sheets, Google forms, Discussions
Outcome:
-
Unified data sources into one accessible dashboard.
-
Removed bottlenecks by decentralizing insights.
-
Increased efficiency and accelerated decision-making.
Deliverables:
Each phase of this project included multiple activities and their corresponding deliverables. These deliverables have been outlined as follows.
Research Phase: Google docs with transcribed interviews, Affinity maps to synthesize and analyze interview insights, and user profiles document.
Design Phase: Task flows using Miro, paper sketches, and Final prototype using Figma.
Evaluation Phase: Heuristic evaluation document and user survey to calculate System Usability Score.
The final poster included - (1) Research and user goals/needs. (2) Dashboard design mapped to user expectations. (3) Testing, feedback, and future scope.
The prototype: Link